Matplotlib 提琴图——violinplot()函数
原文:https://www.studytonight.com/matplotlib/matplotlib-violin-plot-violinplot-function
在本教程中,我们将介绍提琴图以及如何使用 Matplotlib 库中的violinplot()功能创建提琴图。
提琴图用于表示不同数值下数据的概率密度,与 马特洛特利布盒图 十分相似。
这些图主要是箱折线图和直方图的组合。
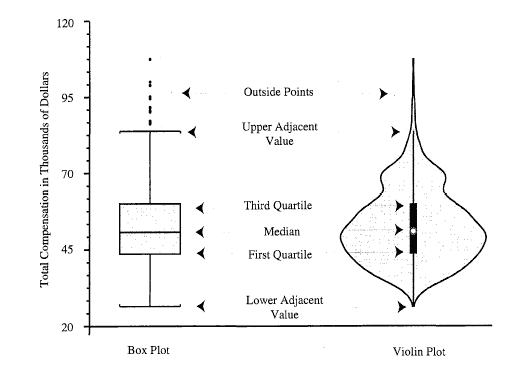
提琴图通常描绘数据的分布、中位数、四分位数范围。
其中,四分位数和中位数是统计信息,由箱折线图提供,而分布由直方图提供。
提琴图也用于表示不同“类别”之间可变分布的比较;就像盒子图。
提琴图的信息量更大,因为它们显示了数据的完整分布。
下图显示了盒式情节和提琴情节的常见组成部分:
提琴情节的创作
violinplot()方法用于提琴图的创作。
该方法所需的语法如下:
violinplot(dataset, positions, vert, widths, showmeans, showextrema,showmedians,quantiles,points=1, bw_method, *, data)
因素
该功能的参数描述如下:
数据集
This parameter denotes the array or sequence of vectors. It is the input data.
位置
This parameter is used to set the positions of the violins. In this, the ticks and limits are set automatically in order to match the positions. It is an array-like structured data with the default as = [1, 2, …, n].
绿色
This parameter contains the boolean value. If the value of this parameter is set to true then it will create a vertical plot, otherwise, it will create a horizontal plot.
显示方式
This parameter contains a
booleanvalue with false as its default value. If the value of this parameter is True, then it will toggle the rendering of the means.表现极端
This parameter contains the boolean values with false as its default value. If the value of this parameter is True, then it will toggle the rendering of the extrema.
显示中间值
This parameter contains the boolean values with false as its default value.If the value of this parameter is True, then it will toggle the rendering of the medians.
量词
This is an array-like data structure having None as its default value.If value of this parameter is not None then,it set a list of floats in interval [0, 1] for each violin,which then stands for the quantiles that will be rendered for that violin.
分
It is scalar in nature and is used to define the number of points to evaluate each of the Gaussian kernel density estimations.
bw_method
This method is used to calculate the estimator bandwidth, for which there are many different ways of calculation. The default rule used is Scott's Rule, but you can choose ‘silverman’, a scalar constant, or a callable.
现在是时候深入一些例子来澄清概念了:
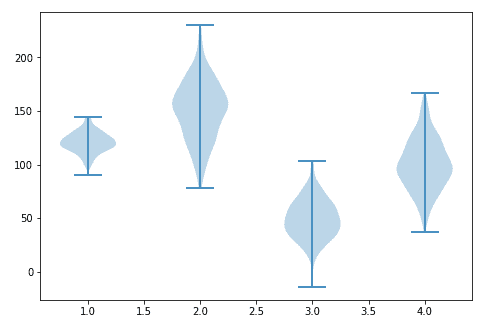
提琴图基本示例:
下面我们有一个简单的例子,我们将为不同的数据集合创建提琴图。
import matplotlib.pyplot as plt
import numpy as np

np.random.seed(10)
collectn_1 = np.random.normal(120, 10, 200)
collectn_2 = np.random.normal(150, 30, 200)
collectn_3 = np.random.normal(50, 20, 200)
collectn_4 = np.random.normal(100, 25, 200)

data_to_plot = [collectn_1, collectn_2, collectn_3, collectn_4]

fig = plt.figure()

ax = fig.add_axes([0,0,1,1])

bp = ax.violinplot(data_to_plot)
plt.show()
输出如下:
时间就是活生生的例子!
让我们来看看提琴情节的真实例子:
总结:
在本教程中,我们通过几个例子介绍了如何创建一个提琴图,以及violinplot()方法的各种参数。