Matplotlib 中的数学表达式
原文:https://www.studytonight.com/matplotlib/mathematical-expressions-in-matplotlib
在本教程中,我们将介绍如何在绘制任何数据集时用 matplotlib 编写数学表达式。
写数学表达式
子集 TeX 标记可以用于任何 matplotlib 文本字符串,只需将其放入一对美元符号($) 中即可。
为了制作下标和上标,分别使用
_和^符号。要创建分数、二项式和堆叠数,可以分别使用
\frac{}{}、\binom{}{}和\genfrac{}{}{}{}{}{}命令。此外,可以通过
\sqrt[]{}命令产生部首。对于数学符号,默认字体是斜体。
让我们举个例子来更清楚地理解。
使用数学表达式:
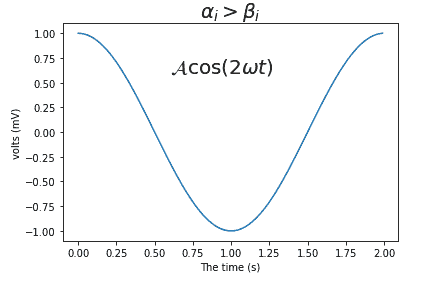
在下面给出的例子中,我们将表示下标和上标:
r'$\alpha_i> \beta_i$'

import numpy as np
import matplotlib.pyplot as plt
t = np.arange(0.0, 2.0, 0.01)
s = np.cos(1*np.pi*t)

plt.plot(t,s)
plt.title(r'$\alpha_i> \beta_i$', fontsize=20)

plt.text(0.6, 0.6, r'$\mathcal{A}\mathrm{cos}(2 \omega t)$', fontsize = 20)
plt.xlabel('The time (s)')
plt.ylabel('volts (mV)')
plt.show()
以下是上述代码的输出: